Performance Meter
0%
QUESTION ID:1
Which one of the following does not help maintain genetic diversity at a given locus?
QUESTION ID:2
Which one of the following is potentially explained by the mid-domain effect?
QUESTION ID:3
The graph shows the yield of coffee plantations located at different distances from a patch of primary forest.

Which one of the following options best explains this pattern?
QUESTION ID:4
Which one or more of the following bird species is/are the focus of conservation-oriented captive breeding efforts in India?
QUESTION ID:5
Which one or more of the following is/are not an example of a zoonotic disease(s)?
QUESTION ID:6
Small islands tend to have fewer species than nearby large islands. Which one or more of the following reasons explain(s) this outcome?
QUESTION ID:7
The term “living fossil” applies to which one or more of the following organisms?
QUESTION ID:8
Which one or more of the following reasons has/have been invoked to explain island gigantism?
QUESTION ID:9
Which one or more of the following options represent(s) life history trade-offs?
QUESTION ID:10
Certain plants and animals rely on toxins such as cardiac glycosides for self-defense. Digitoxin and bufalin, structurally similar toxins produced by foxglove plants and bufonid toads, respectively, are one such example. Which one of the following statements about these toxins is correct?
QUESTION ID:11
A behavioural ecologist records the number of times a kingfisher succeeds in catching fish over multiple five-minute intervals. Which one of the following distributions best describes these data?
QUESTION ID:12
Excess fertilizers used in agriculture commonly end up as runoff and cause phytoplankton blooms in rivers. To figure out whether these blooms were driven by ammonium or phosphate fertilizers, researchers cultured a phytoplankton species in multiple samples of unpolluted river water. The samples were divided equally among three treatments: ammonium fertilizer added, phosphate fertilizer added and no fertilizer added. They then measured phytoplankton density in each of the samples after a week. Phytoplankton densities (in thousands of cells/ml) are reported in the table shown.

Which one of the following inferences is correct?
QUESTION ID:13
S1 and S2 are two strains of bacteria. The results of a bacterial growth experiment on these strains measured after 24 hours are shown. Black and white bars represent S1 and S2, respectively.

Which one of the following best describes the interaction between S1 and S2?
QUESTION ID:14
Habitat P has twice the density of resources as habitat Q. Assume that individuals are identical, can move freely, have perfect information about the environment, and compete for resources when they are in a habitat. At equilibrium, which one of the following represents the predicted outcome?
QUESTION ID:15
Consider Holling’s Type-III functional response, as shown.

Which one of the marked points has the highest rate-of-change of prey-capture-rate?
QUESTION ID:16
In a population of birds on an island, the average beak size reduced over one generation. A researcher estimated the association between beak size and relative fitness, shown in the graph. The estimated slope was −0.05 with a 95% confidence interval of −0.15 to 0.09

Which one of the following evolutionary processes acting on beak size is the most
likely reason for the observed reduction in beak size?
QUESTION ID:17
The Bateman gradient is a popular explanation for why the strength of sexual selection is typically stronger on males than on females. Which one of the following figures is the correct representation of the Bateman gradient? In all figures, the dotted line represents males and the solid line females.

QUESTION ID:18
Sparrows use two foraging tactics to obtain food. They either search for grains themselves (Producer tactic P) or follow other individuals and steal grains from them (Scrounger tactic S). The following graphs show how the fitness of each tactic (P : dashed line and S : solid line) varies as a function of the relative frequency of S. Which one of the graphs shows the correct representation of these tactics if they were maintained through negative frequency dependence?

QUESTION ID:19
Some lizard species show positive allometry in head width, with larger individuals investing disproportionately more in musculature leading to wider heads. To test for positive allometry in a study population, a researcher measures body size and head width for 100 individuals and fits a straight line to a log-log plot of these two traits. Which one of the following estimated values of the slope indicates support for positive allometry?
QUESTION ID:20
A team of ecologists laid 100 plots of 50 m × 50 m in a forest and counted the number of individuals of a tree species in each plot. They then calculated the mean and variance of the number of individuals per plot. If trees are randomly distributed, then which one of the following relationships between the variance and mean is expected?
QUESTION ID:21
The following graphs show rank abundance data for species in three different communities P, Q and R. Based on both species richness and relative abundance, which one of the following options correctly represents the ordering of communities according to their species diversity?

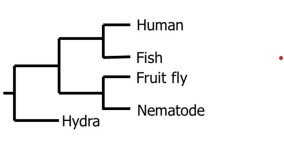
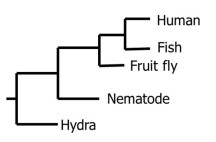
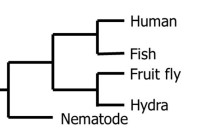
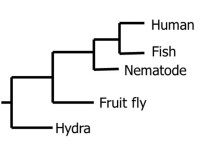
QUESTION ID:22
Which one of the following cladograms represents the correct phylogenetic relationships in the Kingdom Animalia?
QUESTION ID:23
β-diversity quantifies the difference in species composition between two ecological communities. Which one of the following statements is correct about β-diversity?
QUESTION ID:24
Consider the logistic population growth model, given by

where r is the intrinsic growth rate, n is the population size and k is the carrying capacity. Which one or more of the following is/are assumption(s) of the model?
QUESTION ID:25
Which one or more of the following genes/markers is/are typically used for species identification?
QUESTION ID:26
A bee species forages for nectar on a plant species which has yellow flowers. To find out what cues the bees use to recognize the flowers, researchers performed the following experiment. They presented individual bees with the stimuli given below and examined the proportion of bees that approached and landed on the stimuli. The results are shown below.

Which one or more of the following interpretation(s) of the experiment is/are correct?
QUESTION ID:27
Which one or more of the following reason(s) explain(s) why whales use low frequencies (infrasound) for mate-finding and high frequencies (ultrasound) for hunting prey?
QUESTION ID:28
The table shows the relative abundance of three potential prey species in the environment and in the diet of a bat predator.

Which one or more of the following is/are possible interpretations based on the data?
QUESTION ID:29
Which one or more of the following options represent(s) an evolutionary arms race?
QUESTION ID:30
The figure shows an F probability density function. The two dotted lines represent critical values corresponding to a two-tailed F-test at a level of significance of 0.05. The observed F-statistic for two samples is indicated by the solid line. Which one or more of the following inferences is/are correct?

QUESTION ID:31
Which one or more of the following conditions can lead to an increase in tree densities in tropical savannas?
QUESTION ID:32
Gene conversion can lead to which one or more of the following evolutionary outcomes?
QUESTION ID:33
If the observed heterozygosity at a locus is 0.6, which one or more of the following could produce this outcome?
QUESTION ID:34
Which one or more of the following reasons has/have been invoked to explain high species diversity in the tropics?
QUESTION ID:35
n a linear regression with a single continuous predictor and 100 data points, the residual degrees of freedom are _______. (Answer in integer)
QUESTION ID:36
The genome of an organism has 60% GC (Guanine-Cytosine) content. The Adenine in this genome is________%. (Answer in integer)
QUESTION ID:37
The prevalence of flu in a population is 1%. A diagnostic test has a false positive rate of 10% and a false negative rate of 10%. The probability that a randomly chosen person tests positive is ______. (Round off to three decimal places)
QUESTION ID:38
In a deer population, the male-to-female ratio is 1 : 2. The probability that a randomly formed group of size three has 2 males and 1 female is _________. (Round off to two decimal places)
QUESTION ID:39
The fitness 𝑓(𝑛) of an individual in a group of size 𝑛 is given by 𝑓(𝑛) = 𝑛 (10 − 𝑛) At evolutionary equilibrium, groups are found in two different sizes. If one group size is 6, the other group size must be _______. (Answer in integer)