
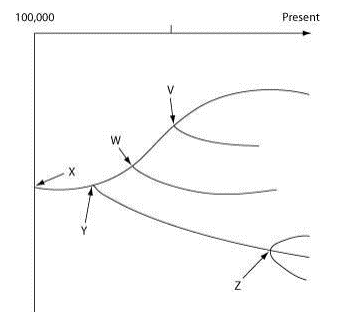
#Question id: 3338
#Section 2: Evolution
If the expected frequency of heterozygotes in a population (based on the Hardy–Weinberg law) is 0.4, but the observed frequency is 0.2, what is the inbreeding coefficient?
#Question id: 3339
#Section 2: Evolution
In a plant species, flower color locus either homozygous or heterozygous with genotype RR-red, Rr- pink and rr- white. The Proportional of pink flower in generation 0 is .50. What is the level of remaining pink flower in a third generation of repeated selfing?
#Question id: 3341
#Section 2: Evolution
In a given population of 400 individuals, 64 percent of population is caused cancer due to completely dominat allele B. Assuming the population is in Hardy- Weinberg equilibrium, which of the following is the expected proportion of individuals who are not expected to develop the cancer?
#Question id: 3342
#Section 2: Evolution
Neutral alleles are those that do not alter fitness and average reproductive success does not differ between individuals that carry one neutral allele or the other. The frequencies of these neutral alleles may change in a population by
#Question id: 3343
#Section 2: Evolution
Following genotype frequency as hardy Weinberg genetic equilibrium in figure. What is the frequency of A1 and A2 allele?
#Question id: 3348
#Section 2: Evolution
What is value of inbreeding coefficient above pedigree?